Introduction
This is a description of my setup to measure the effects of bore perturbation on the resonant frequency of flute-like instruments. It's a bit of a science fair project! I don't have access to a physics lab, so this serves as a proof of concept for whether useful measurements can be made with simple and inexpensive components.
The goal here is not to have a setup to test complex scenarios on real instruments. Rather, it is to build test cases to vet the algorithms and--especially--their software implementations. After that, the complex scenarios are best done in software.
Hardware
Experiments generally measure either passive or active (blown) resonance. In measuring blown resonance, either a person or a machine can do the blowing. In this case, I am measuring blown resonance using a machine. As building an artificial embouchure to blow a transverse flute is challenging, I chose to simplify matters by using a whistle-type mouthpiece as a close analog of the flute embouchure hole. In a nutshell, I am blowing a low whistle with compressed air and inserting sleeves in the whistle bore to alter the pitch. Initially I'm using a cylindrical bore, but I intend to add a conical bore at a later time. Since I am only studying bore perturbation, the test fixture does not have tone holes (though there is no reason why they could not be added).
Here is a picture of the setup:
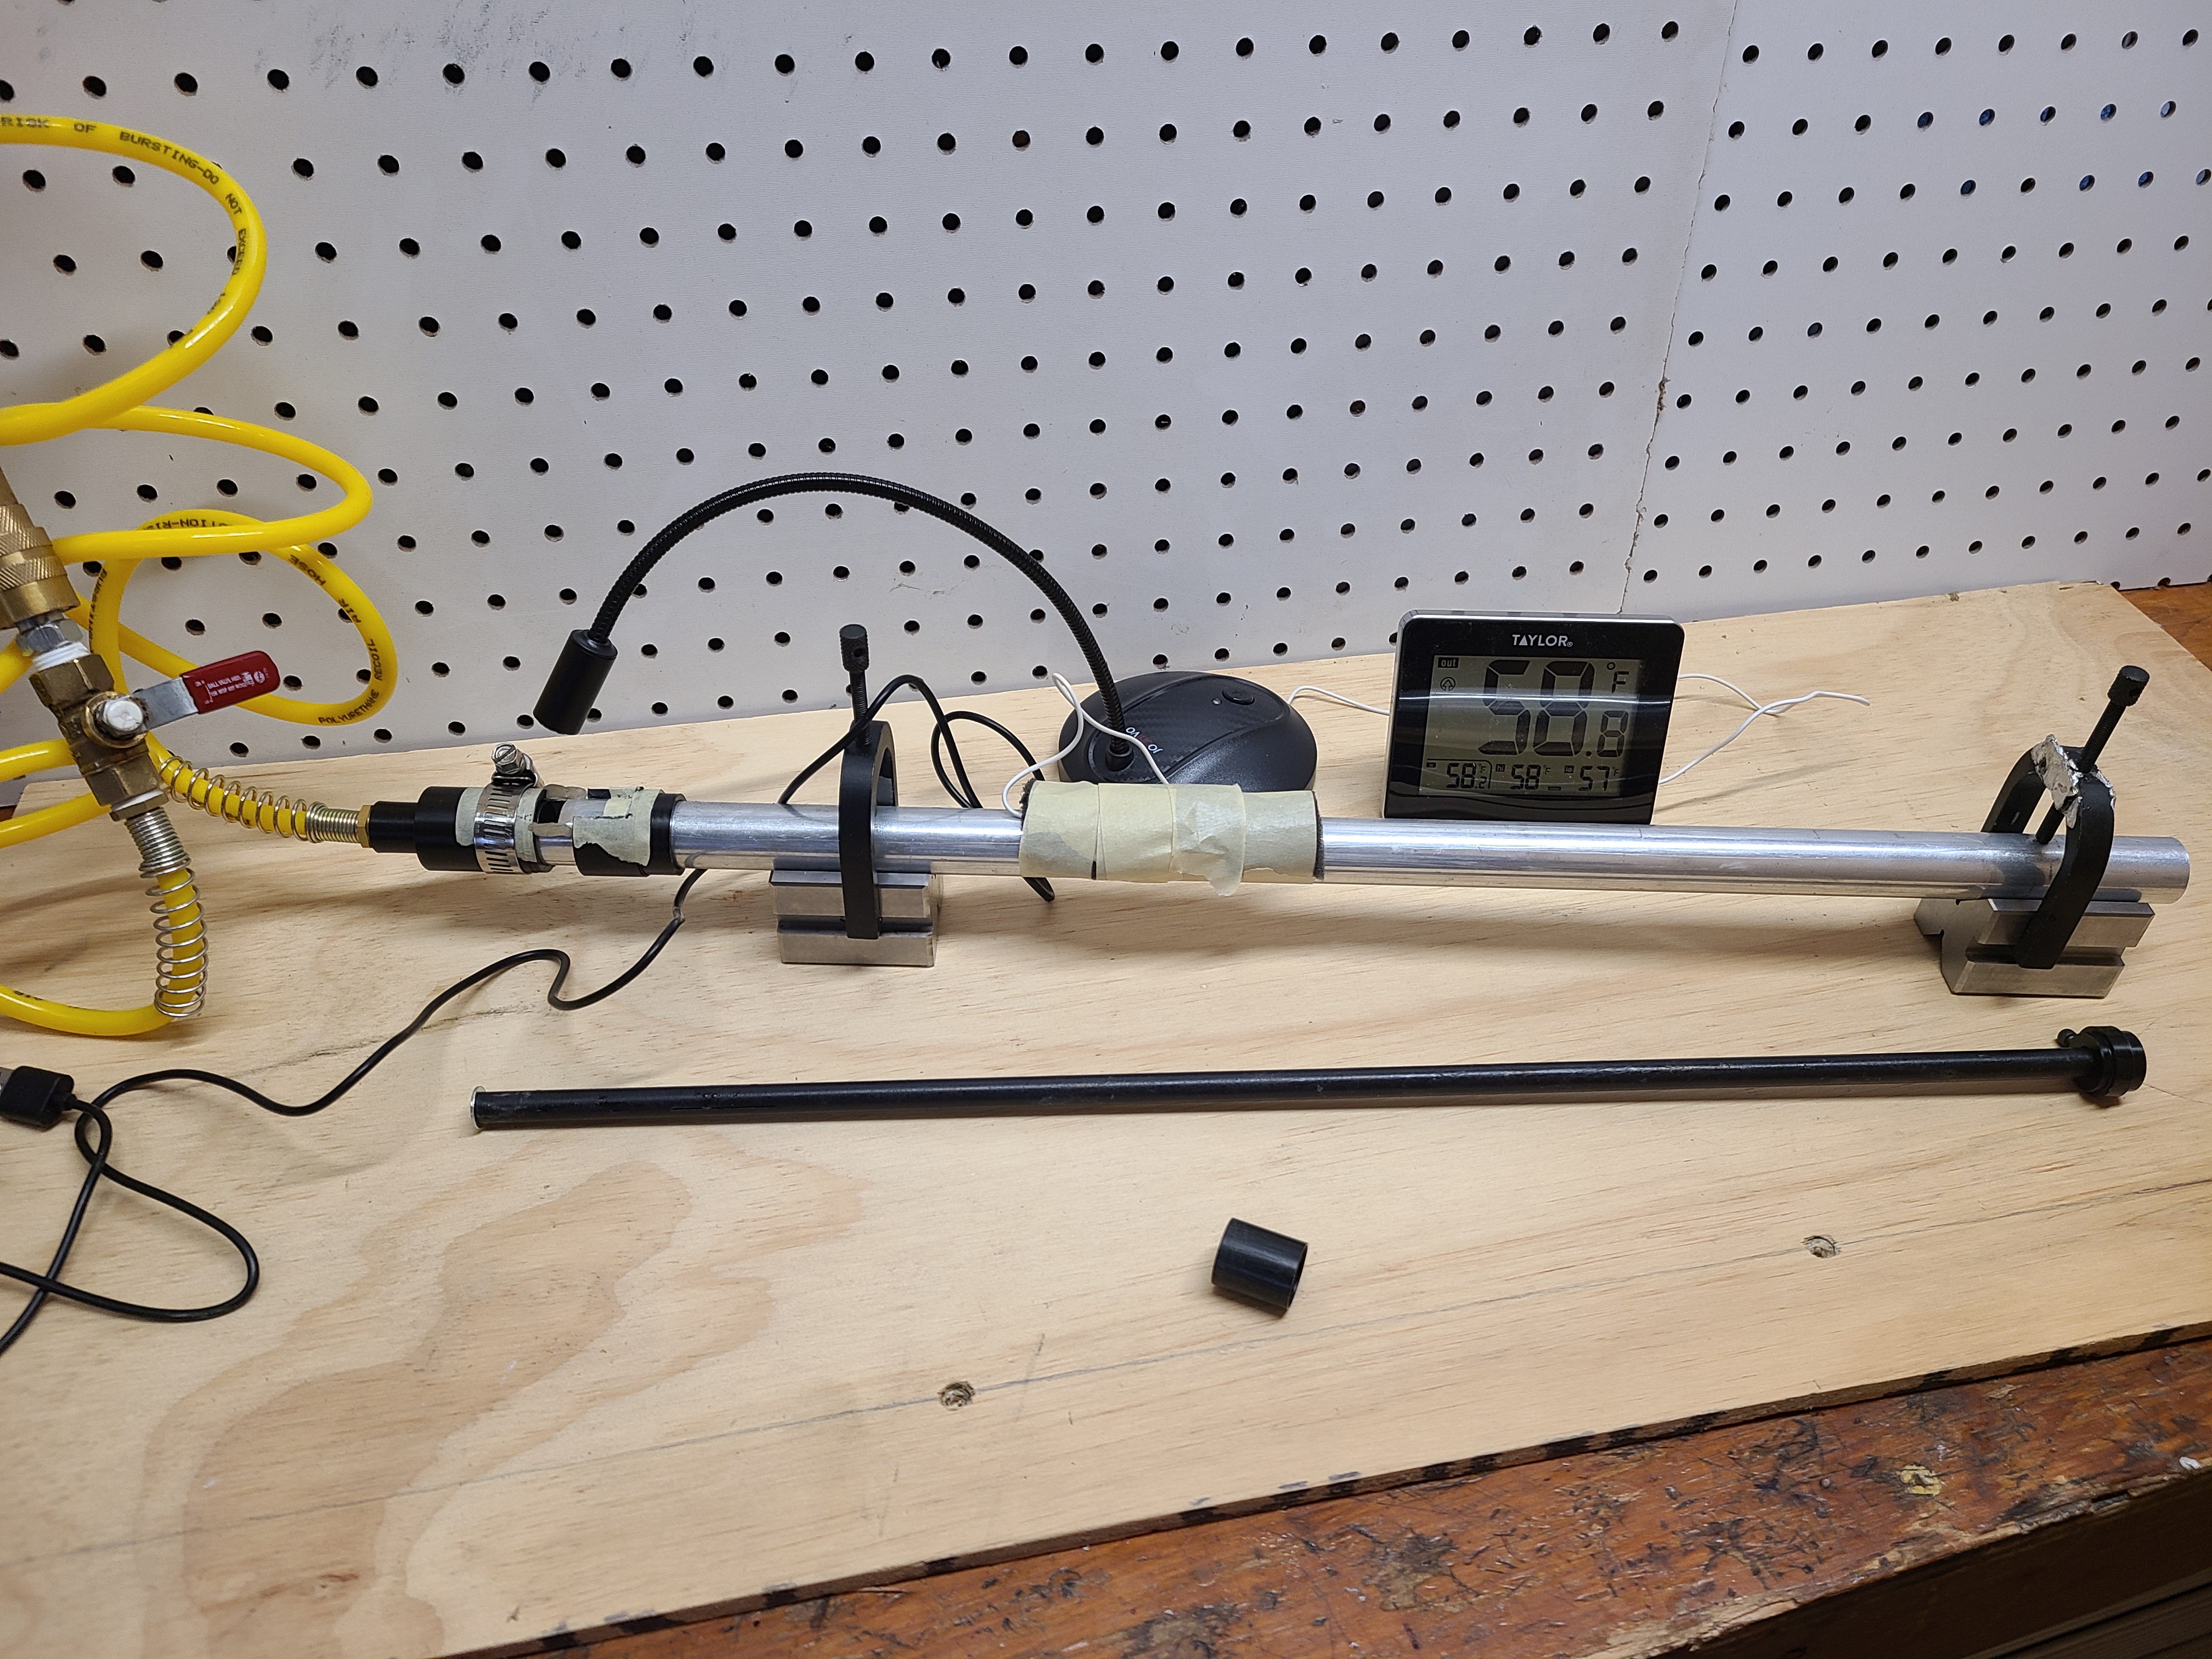
I made a whistle mouthpiece and attached it to a cylindrical aluminum tube. Sleeves are pushed into the tube a measured amount by using a rod with an adjustable collar. Cylindrical bore sections are convenient as the sleeves can be placed anywhere in the bore. A future version will involve placing the mouthpiece on a conical bore; in that case the perturbation elements will be more specific to a particular location.
The mouthpiece is fed by compressed air controlled first by the pressure regulator on the air compressor, and then by a ball valve for finer adjustment. A thermometer probe from an inexpensive indoor/outdoor thermometer is attached to the body and covered with some insulating foam. The inner cork and outer hood of the mouthpiece are movable and can be fixed with a hose clamp. This allows adjustment of the window size, which is useful in selecting which harmonic is blown. A small microphone is pointed at the fipple and connected to a laptop computer via USB.
Experimental Procedure
The experimental procedure is as follows:
- Turn on the air compressor.
- Adjust the ball valve and window size for a stable tone at the desired harmonic.
- Wait until the body temperature has (mostly) stabilized.
- Turn off the air compressor to reduce noise and possible pressure fluctuations.
- For each measurement,
- Note the body temperature.
- Record the base note for approximately 1 minute (in a CD-quality WAV file)
- Insert the sleeve, and note its position.
- Continue recording the perturbed frequency for another minute.
Since the speed of sound varies with temperature, it is important to have an indication of the temperature inside the bore. The temperature of the compressed (and then un-compressed) air will generally be different than room temperature, so it is important to let the setup reach thermal equilibrium before measuring. With the compressor off, the run can continue as long as the tank supplies stored air.
In this form of the experiment, the length of the body is constant while the location of the sleeve is varied between the end and the middle. This is a good starting point because a) the perturbation effects are relative to their position in the standing wave and b) the standing wave is symmetrical (barring end/embouchure corrections).
Temperature and Pitch Stability
There are several factors that can affect the stability of the base frequency:
- Air temperature change in the bore
- Pressure variation due to the mechanism of the mechanical regulator
- Instability in the air reed vibration
Using the formula for speed of sound vs temperature, at 70F the resonant frequency will change by 1.6 cents per degree F. Because we are ultimately calculating a frequency ratio, temperature effects will tend to cancel out if the temperature is reasonably stable when the two frequencies are measured.
Pitch Analysis
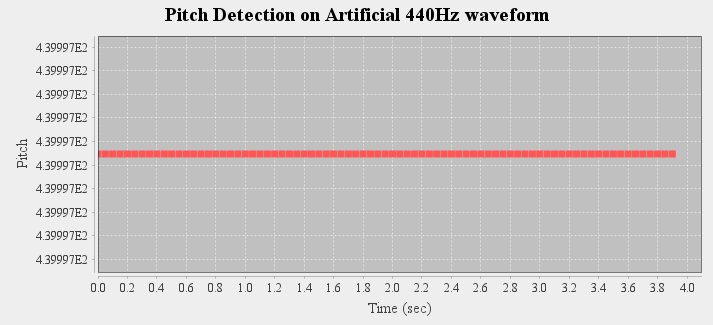
Pitch is measured by a program using McLeod's MPM algorithm. I am using a Java version, but freely available programs based on McLeod's Tartini software should do as well. This method presents ideal conditions for pitch detection: the tones are long, and the pitch is relatively stable. Under such conditions autocorrelation-type algorithms like MPM and AMDF can be quite accurate; some experiments I have done on artificial data suggest they can be good to 0.1 cent.
As a sanity check, the pitch detection algorithm was run on a computer generated multi-harmonic sinusoidal waveform of 440 Hz. As shown below, the algorithm is very stable:
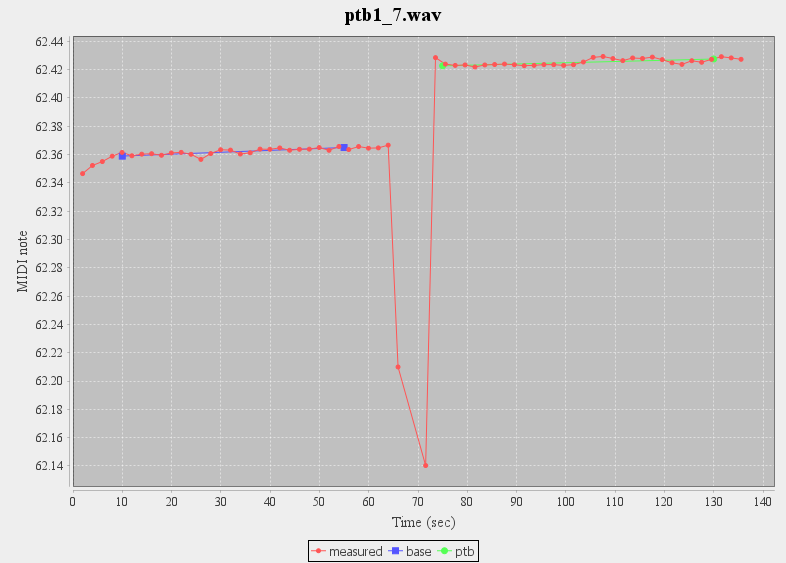
Here is a typical result from the experimental procedure described above:
The pitch is shown as MIDI notes; in this graph the grid is at a 2 cent interval. As there is some variation in pitch, a best-fit line is calculated for both the base and perturbed measurements. Although I haven't done statistics, it looks like applying a regression line to the pitches should allow accuracy to about 1 cent. The time interval in which the sleeve is being inserted is ignored. The pitch difference is calculated as the vertical distance between the (projected) best-fit lines at the midpoint between them. The pitch variation is interesting; it could be due either to pressure variation or instability in the acoustic vibration.
|