Introduction
In traditional aerophone instruments like the flute and whistle the second octave is often out of tune with
the first octave. Measuring this difference is made more difficult by the fact that the pitch of a note varies significantly with breath pressure. When using a tuner (or tuning software) to measure octave tuning, the player typically strives to maintaining a consistent pressure/volume for all notes to minimize this effect. It occured to me recently that we may be ignoring valuable information by doing this, and that pitch-volume variation could actually improve tuning analysis.
The idea is as follows: if we are analyzing a recording that has significant dynamic variation, the recording itself contains the information we need to establish the pitch-volume relation. We can use this to extract tuning information, in particular for octaves. I call this Pitch-Volume Tuning Analysis (PVTA).
PVTA is different from RTTA like the McGee-Roxburgh Polygraph RTTA
[McGee3]
. PVTA uses the same type of pitch data input, but analyzes it in a different way. The classic bar-graph view of the Polygraph combines pitch distribution information for all notes into a single view, and is very easy to use. PVTA, on the other hand, is analogous to looking at only a pair of notes through a microscope, moving the slide around and fiddling with the focus. It exposes more detail but is more time-consuming and requires some human judgement (no, I haven't tried using AI). It also requires more care in recording, which I explain below under Details.
An Example
To paraphrase an old saying, a graph is worth many words. I will show a PVTA example to measure the octave tuning between two notes. The PV Analyzer pictured below is available here.
I made a recording of notes G4 and G5 played on a flute at varying volume levels. The analyzer finds the "chunks" of the recording with a well-defined pitch and graphs the pitch of each chunk vs. its volume as shown:
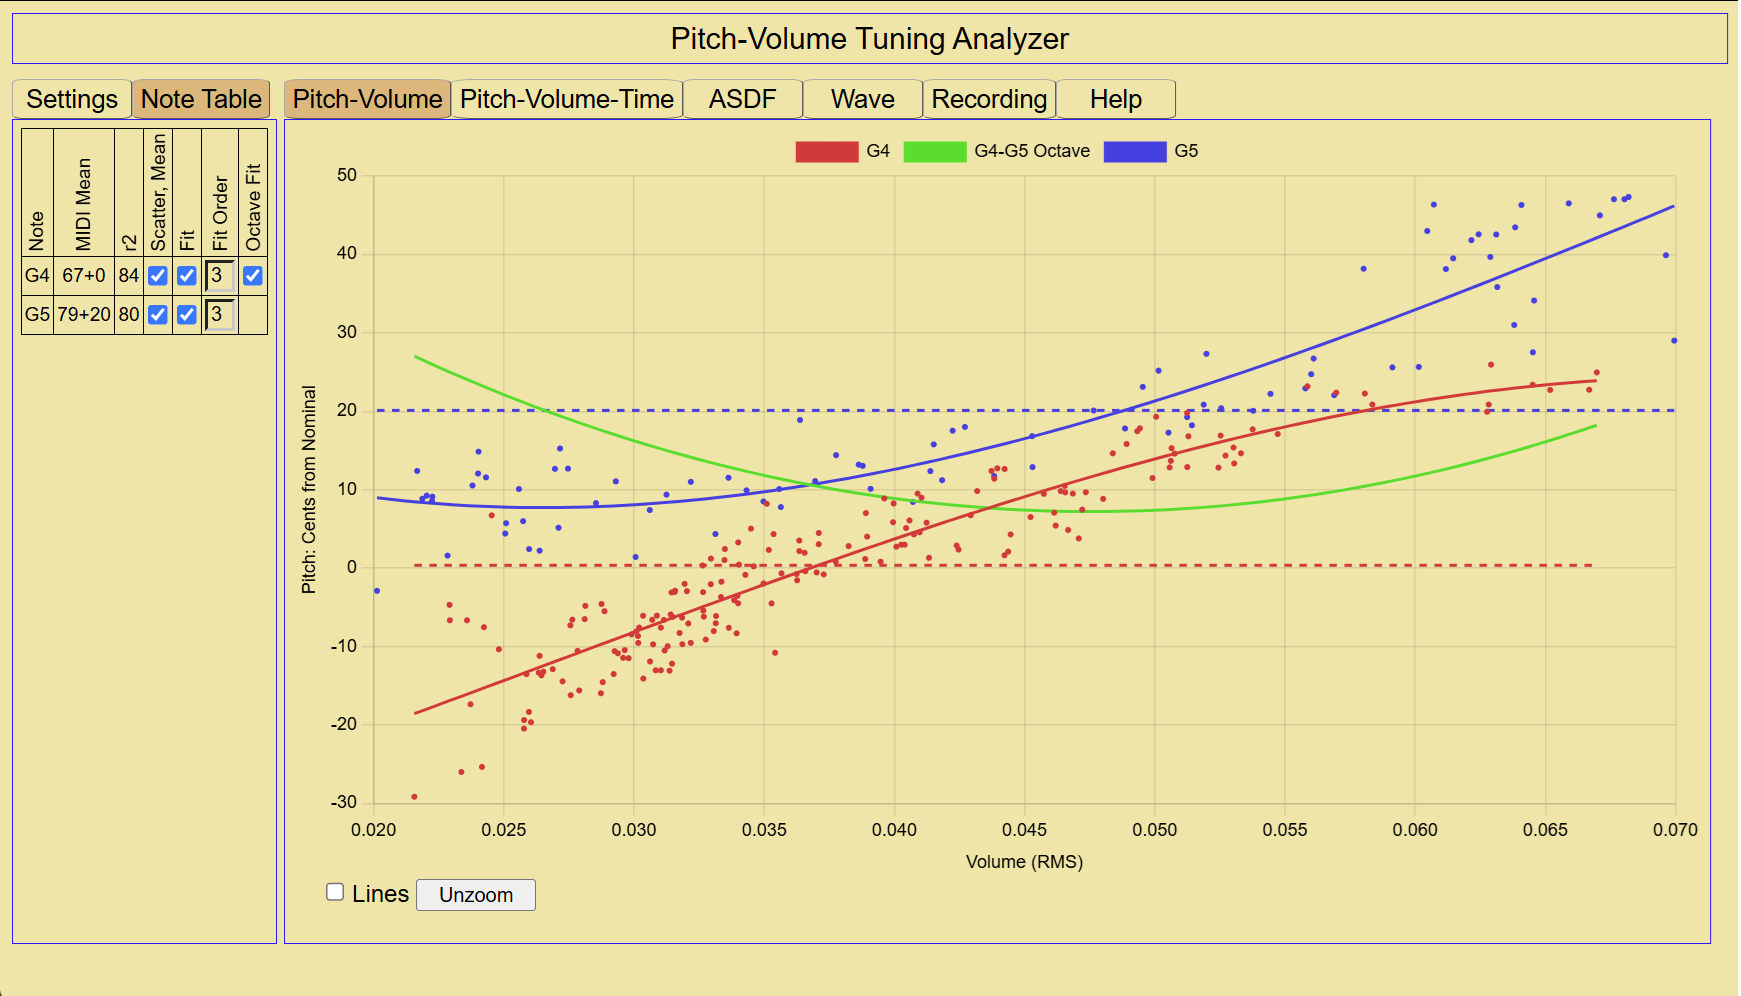
Regression is used to fit a polynomial curve through the points for each note. The line labeled "G4-G5 Octave" is the difference between these two fitted curves. The horizontal dashed lines are the mean value of the pitch for each note. It is apparent that:
- There is a strong relation between pitch and volume (as expected). The "R2" column in the note table is a statistical measure of this.
- The octave "stretch" is a function of volume, varying from 20 cents at low volumes to 10 at higher volumes.
- The fit curves for first and second octaves curve in opposite directions. I have not done enough measurements to say if this is a consistent behavior across notes.
Here is the PVTA for G5/G6 on a Generation-like whistle:
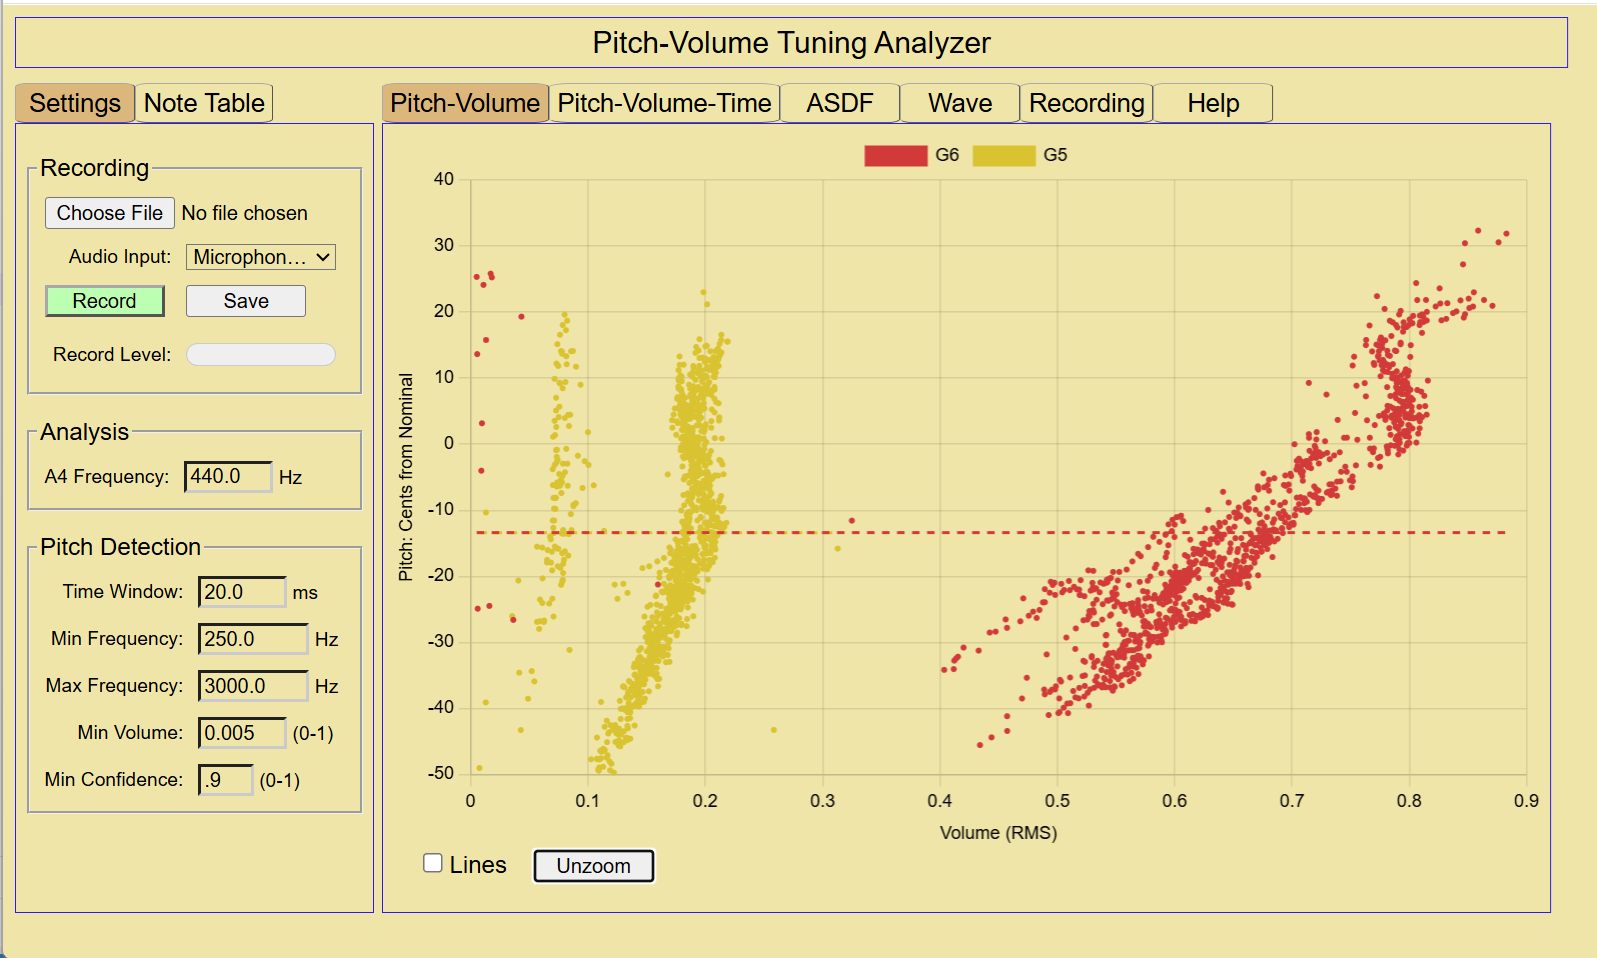
This plot shows that the lower octave is much softer than the upper one. This raises questions that are
discussed under "Comparable Volumes" below. The PV Analyzer allows offsetting the lower octave series
by a given volume in order to align it with the octave series.
Details
The PV Analyzer uses the RMS amplitude of the PCM values in an audio recording. Microphones measure acoustic pressure. Ideally, we would measure the acoustic pressure inside the instrument, but for convenience we are using the recorded volume as a proxy for that pressure. The proportionality between recorded and internal pressure will be different between each recording unless special care is taken to use an identical setup. A microphone mounted on (or in) the instrument would help. Lacking a method of calibration, volume comparisons should only be done within a single recording. Ideally, one has:
- a microphone with flat frequency response,
- a room with very low sound reflection and resonance,
- the microphone at a consistent distance and angle from the instrument,
- a lossless recording format (ie no volume-altering compression algorithms),
- no automatic gain control (AGC) in the recording chain.
Minimum Volume: In the example above, all "chunks" with a volume of less than .02 have been excluded. There are two reasons for doing this. First, the pitch detection algorithm will pick up unwanted signals from background noise. Secondly, very soft notes--or the beginning and end of notes--don't have a
well-defined pitch and will cause increased scatter.
Volume vs. Loudness: Human perception of loudness is complicated. It is logarithmically related to volume, and also depends on frequency as shown by the Fletcher-Munson curves. Because of the nonlinearity, some tuning analyzers display volume with a logarithmic decibel (db) scale. At the moment the PV Analyzer uses a linear scale.
Comparable Volumes: In the calculation above, we have compared the pitches (Y values) for the same volume (X value). In this case the flute player's "soft-to-loud" range in both octaves spans similar ranges of sound pressure, so using the same volume for octave comparison seems reasonable. However, other musical instruments have inherent differences in the volume range of each octave--for instance, the penny whistle. At least for the traditional cylindrical whistle, the low octave can be much softer than the upper. This brings up an interesting question of what volume level to use for comparison. For instance, one could compare the middle of the low octave volume range against the middle of the high range. This corresponds to the choice a whistle player faces when selecting a volume for upper octave notes. This also means that the octave "stretch" (or shrink) is a function of this offset as well as a function of volume.
Future Work: There is quite a bit of scatter in the PV plots. This could be a real effect, or it could be due to issues in the hardware/software chain. I plan to investigate this. I am going to add a "shift" function
that will make it easier to compare octave tuning on whistles or other instruments with a soft low octave. I also plan to add time animation to
the PV plot to see if the trajectory holds any information.
| 